In contrast to traditional cancer treatments such as surgery, chemotherapy, and radiotherapy, photodynamic therapy (PDT) is emerging as a novel method that uses specific wavelengths of light to activate photosensitizers. This activation generates reactive oxygen species that effectively destroy tumor cells. PDT is known for its high targeting precision, minimal damage to the body, and reduced likelihood of resistance development. Although PDT shows promising potential in treating solid tumors, including hepatocellular carcinoma, monitoring its dynamic therapeutic effects remains challenging. Traditional methods struggle to efficiently and accurately measure cellular changes without fluorescent labeling.
To address this issue, JIANG Yuqiang’s research team from the Institute of Genetics and Developmental Biology (IGDB) of the Chinese Academy of Sciences (CAS) has incorporated deep learning technology into PDT.
Building on previous developments using gold nanoprobe technology for efficient radiodynamic and photodynamic cancer treatment, the researchers highlighted the significant potential of deep learning in understanding the dynamic impact of PDT on cancer cells, showcasing its important applications in cancer treatment research and paving the way for future precision medicine.
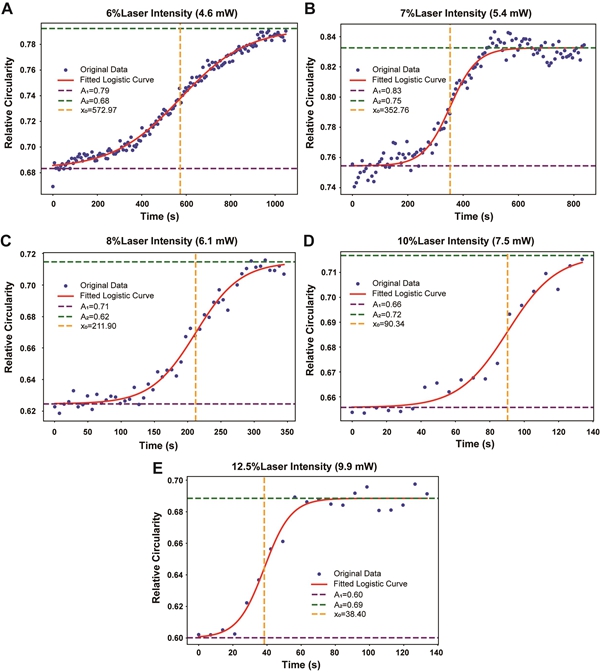
They used an advanced instance segmentation algorithm, Cellpose, for reliable morphological analysis of PDT-treated cancer cells. Using logistic growth model analysis, the researchers predicted cellular behavior after PDT. Experimental results show significant changes in cancer cell morphology and proliferation capabilities following PDT treatment. Model validation further supports these findings.
This study demonstrates that deep learning tools can extract subtle changes in target cell morphology from high-dimensional data, revealing the complex dynamic changes in cell morphology during PDT. This not only helps to optimize PDT parameters, but also provides potential personalized cancer treatment strategies.
Typical instance segmentation results obtained by the Cellpose algorithm at different time points and laser intensities ranging from 6% (4.6 mW) to 12.5% (9.9 mW). The white lettering in the upper left corner of the image represents the relative time point, with a time format of mm:ss.sss: (A-C) 4.6 mW, (D-F) 5.4 mW, (G-I) 6.1 mW, (J-L) 7.5 mW and (M-O) 9.9 mW, respectively. Scale bars: 30 μm. (Image by IGDB)

Typical dynamic profiles of cellular circularity in different groups with different PDT laser intensities. The data points, represented by blue dots, represent the observed experimental measurements of cell circularity at different time intervals. The orange curve represents the fitted logistic growth model superimposed on these data points. This model is characterized by an ‘S-shaped’ growth pattern: an initial slow growth phase, followed by a rapid exponential increase and a final plateau at a maximum limit. The results obtained under laser intensities of 4.6 mW, 5.4 mW, 6.1 mW, 7.5 mW, and 9.9 mW, respectively, are as follows: A-E. (Image by IGDB)

