Epidemiology of HFMD in Guangdong, China, 2013–2021
The HFMD reporting, sample collection and the molecular typing scheme was illustrated in Fig. 1. According to the provincial notifiable disease report system, a total of 3,009,233 clinically confirmed HFMD cases were reported in Guangdong, China, 2013–2021, with the highest number of cases reported in 2014 (n = 429,617) and the lowest in 2020 (n = 60,501) (Fig. 2a). RT-PCR testing for EV and specific genotypes EV-A71, CVA16 were required for collected HFMD suspicious samples in 2013–2016, which were extended to EV-A71, CVA16 and CVA6 in 2017. A total of 36,461 HFMD suspicious samples were collected for genotyping during 2013–2021, of which 26,086 (71.54%, 26,086/36,461) were detected as positive for EV. For EV genotype distribution, the ratio of EV-A71 and CVA16 were fluctuated over time. An increased CVA16 epidemic was observed every two years with a relative higher ratio (> 25%) detected in 2014, 2016, 2018 and 2021, respectively (Fig. 2a). In contrast, the low positive rate (
Enterovirus distribution in HFMD cases in Guangdong, China, 2013–2021. (a) The EVA71 and CVA16 distribution in 2013–2016, and EVA71, CVA16 and CVA6 genotypes distribution in 2017–2021; (b) The enterovirus genotype distributions in other enterovirus positive (non-EVA71 and non-CVA16 in 2013–2016; non-EVA71, non-CVA16 and non-CVA6 HFMD cases in 2017–2021) HFMD cases. EV, enterovirus; CV, Coxsackievirus; HFMD, Hand, foot and mouth disease
Different from the etiology pattern of HFMD observed in 2008–2013, an increasing detection of EV genotypes other than EV-A71 and CVA16 had been noted since 2013. Our previous reports highlighted the predominance of CVA6 in HFMD cases in Guangdong by the end of 2013 [20, 27]. The sustained high incidence of CVA6 from 2013 to 2021 indicated that this genotype had become endemic in the region. Among the 3,119 samples identified as non-EV-A71/CVA16/CVA6 EVs, CVA10 constituted the largest proportion between 2013 and 2021, peaking in 2018 with a prevalence of 64.60% (500/774). Notably, CVA4 exhibited a significant upward trend, reaching the highest detection rate in 2021 at 29.82% (243/815). Additionally, CVA2, CVA5, and CVA8 were commonly detected in HFMD suspected cases, indicating a multifaceted etiological pattern of HFMD in Guangdong, China (Fig. 2b).
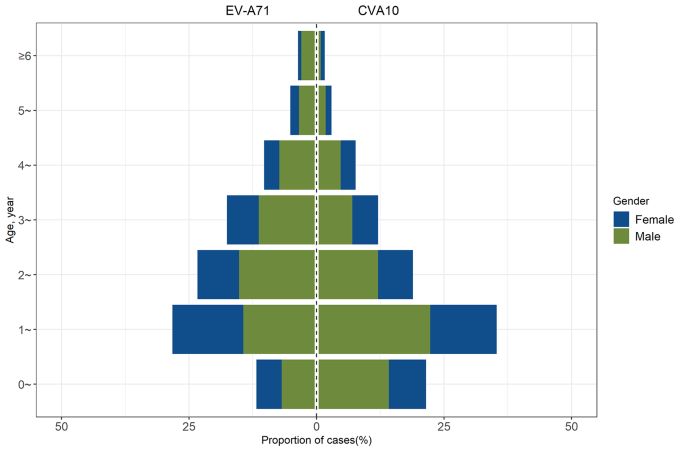
The prevalence of CVA10 from 2013 to 2021 had spurred an investigation into the epidemiological characteristics of CVA10 infections. We conducted a retrospective analysis of 614 cases of CVA10 infections and 467 cases of EV-A71 infections reported in the provincial notifiable disease surveillance system between 2017 and 2021. An overwhelming majority, 98.37% (604/614) of CVA10 and 96.36% (450/467) of EV-A71 infection cases, occurred in children under five years of age. Notably, the highest incidence rates for both CVA10 and EV-A71 infections were observed in the 1- to 2-year-old cohort. The median age for patients with CVA10 was 1.8 years, significantly lower than the median age of 2.3 years for EV-A71 infections (P P > 0.05), as illustrated in Fig. 3.
Phylogenetic structure of VP1 gene and viral genome
To date, there were only a limited number of genome sequences, as well as the VP1 gene sequences, of CVA10 in public database. In order to gain the insight into the phylogenetic distribution of viruses and mutations potentially associated with the increasing epidemic, we generated a total of 78 complete or near-complete CVA10 viral genome sequences in our study, representing the samples collected from 2010 to 2021. Phylogenetic analysis was conducted by including 402 CVA10 genome sequences available from public database.
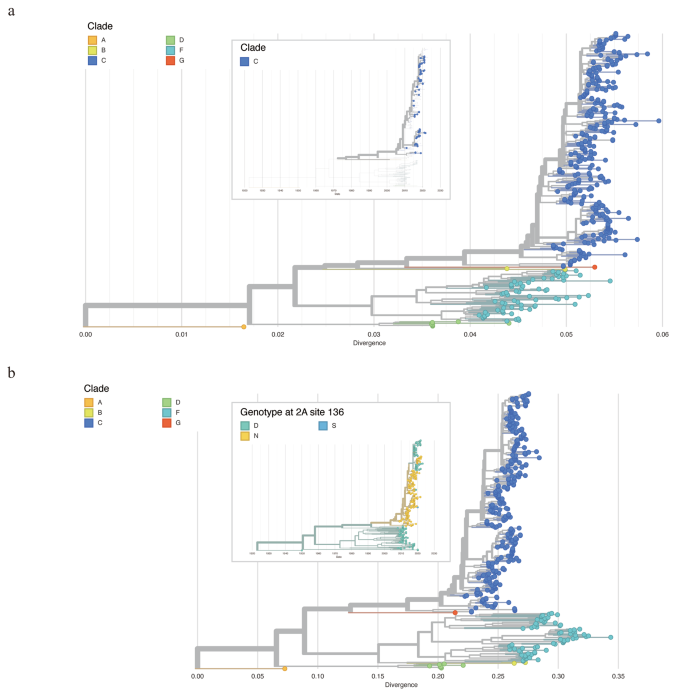
Firstly, all CVA10 genome sequences were aligned to AY421767 as the reference genome. The corresponding VP1 gene were then stratified (2477-3377nt) and used for phylogenetic construction. We followed the VP1 classification scheme from the previous studies [28, 29], and all sequences could be classified into six genogroups. The VP1 gene similarities between different genogroups ranged from 74.94 to 86.47%, with genotype group A and D showing the greatest divergence (Table 1). Endemic circulation was observed in the phylogeny, with all Guangdong CVA10 genome sequences belonging to genogroup C. According to the phylogeny, the increasing prevalence of CVA10 was most likely caused by the two subcluster of genogroup C viruses representing the largest genetic cluster after 2015 (Fig. 4a, upper panel).
Maximum likelihood tree of CVA10 constructed based on VP1 (a), complete genome (b). The zoomed-out image in the upper panel of (a) illustrated the time scaled phylogenetic tree of VP1 and only Guangdong sequences generated in this study were displayed. The zoomed-out image in the upper panel of (b) illustrated the time scaled phylogenetic of CVA10 genome. The tree was colored according to the amino acid at 136th site of 2 A protein
Secondly, we reconstructed the phylogeny by using CVA10 genome sequences and the clade was annotated according to the VP1 classification results (Fig. 4b). Ancestral sequence reconstruction with maximum likelihood method illustrated the most possible ancestral sequences for each node and the corresponding amino acid mutations occurring at each branch. Interestingly, the ancestral sequence reconstruction revealed the internal branch giving rise to the newly emerged sub-cluster of group C, encompassing the majority of CVA10 sequences gathered post-2017 (84 in 202, 41.58%), harbors a unique amino acid mutation, N136D, in the 2 A protein. This non-synonymous mutation stands in stark contrast to the 104 synonymous mutations identified across the entire genome sequences. (Fig. 4b).
Notably, the amino acid at 136th site was frequently altered during the virus evolution. The internal branch leading to the genogroup C of CVA10 including the N136D mutations and the sequences from all other genogroups were aspartic acid (Asp, D) at the 136th site of 2 A protein. The reverse mutation could be observed in the new emerged sub-cluster of group C as mentioned above. Additionally, we observed that a small group in the newly emerged cluster had N136D mutation in 2 A protein, accompanied by other amino acid mutations in the 3 A, 3 C and 3D proteins. The biological function of the mutations at 136th site of 2 A protein should be further analyzed to understand the evolution mechanism of CVA10 virus.
Frequent recombination among CVA10 and other enterovirus a viruses
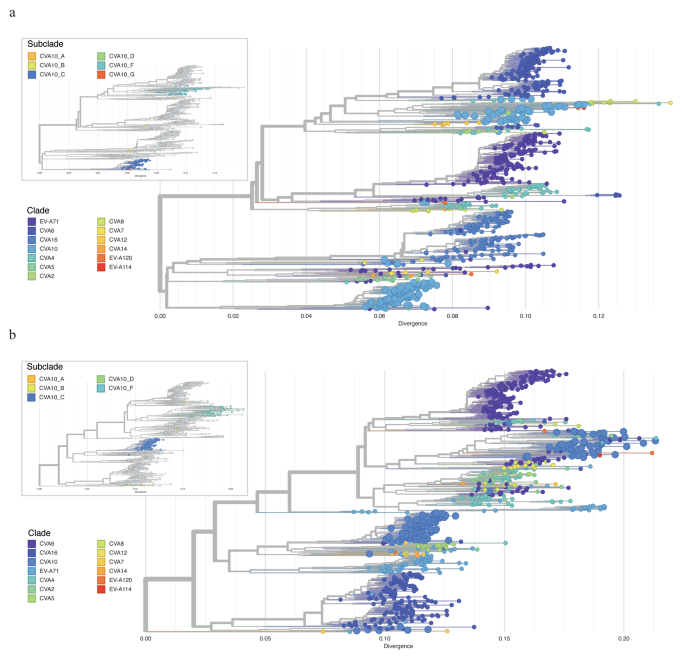
The genogroup annotations on VP1 sequences and whole genome sequences of CVA10 revealed the difference in phylogenetic structure of these two (Fig. 4a-b). In detail, the genogroup B of CVA10 sequences were closely related with genogroup G and genogroup C in phylogeny of VP1 but were clustered with genogroup F strains in phylogeny of genome sequences. This discrepancy highlighted the potential for intra-genogroup recombination or inter-EV species recombination during the evolution of the CVA10 virus. To investigate potential clues for genetic recombination, we stratified the sequences of P1, P2 and P3 regions of CVA10 genome respectively. Similarly, the genogroup G of CVA10 were more closely related with genogroup F in phylogeny of non-structure protein coding sequences (P2 and P3) which was inconsistent with the phylogeny of structure protein coding region (P1) (Supplemental Fig. 1a-c). Recombination was known to be frequent among species of EV in their non-structure protein coding regions [30, 31]. To elucidate the relationship between CVA10 and other EV species, we reconstructed the phylogeny of P2 and P3 by including all closely related sequences from other EVs. For P2 region, all genogroups of CVA10 were dispersed throughout the phylogenetic tree and clustered with other EV species rather than with other genogroup CVA10 sequences, highlighting the potential for inter-species recombination (Fig. 5a). Specifically, the P2 fragments of genogroup F fell into three different main clusters, indicating potential recombination between CVA10 genogroup F and CVA2, CVA4, CVA8, EVA114, EVA120 and other species. Genogroup C, the predominant CVA10 strains in mainland China, were all clustered together, with only one sequence (MF422532) possibly having recombination with EV-A71 and CVA2 species. Similar results were found for P3 region (Fig. 5b), where genogroup F sequences were closely related with other EV species and clustered into multiple clusters. The complex interactions between genogroup F of CVA10 and other EVs in non-structure protein coding sequences indicated the possible wide circulation of this genogroup in the population. To confirm the existence of recombination events in genogroup F of CVA10, Simplot analyses were conducted with the other EVs (Fig. 6). The results revealed multiple recombination events between genogroup F of CVA10 and EVA120, CVA2 and CVA4 in the P2 coding regions with bootstrap values over 70%.
Recombination analysis of genogroup F of CVA10. Bootscanning recombination analysis between genogroup F of CVA10 and EVA120 (a), CVA2(b), CVA4(c). The representative strain (EVA120: MT081367, CVA2: MF422537, CVA4: OM417121) were used as query sequences respectively. The dashed line indicates > 70% bootstrap support. The genome structure of the CVA10 was annotated according to the CVA10 reference strain AY421767.


