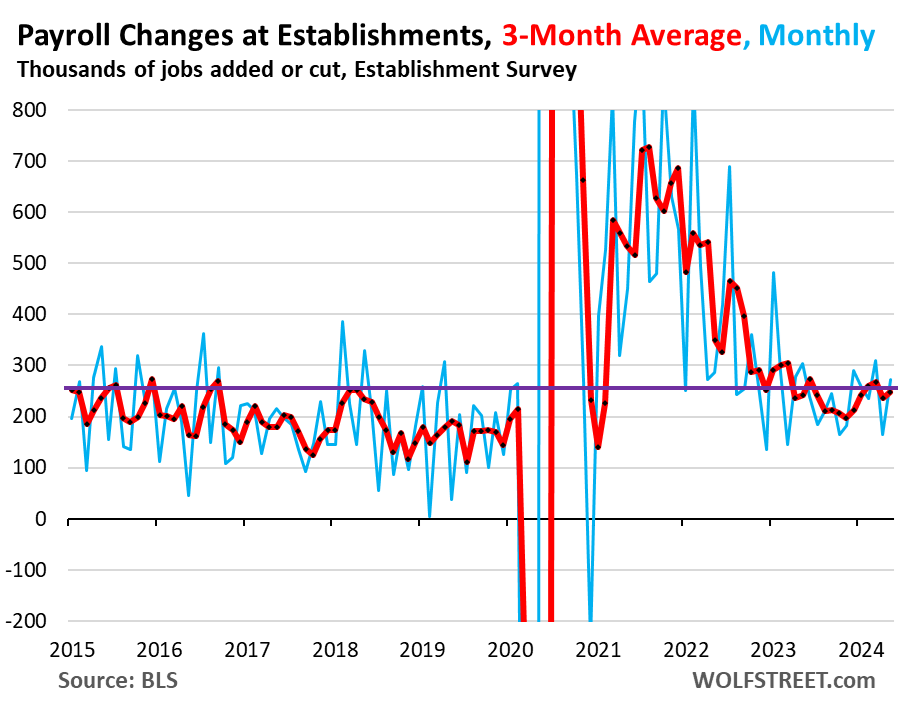
Three-month averages have been steadfast: higher-than-normal job creation and wage increases.
By Wolf Richter for WOLF STREET.
Look, today’s jobs report shows why we don’t get too excited about the month-to-month squiggles in the jobs data (blue lines in the charts below). The labor market doesn’t turn around from one month to the next suddenly, unless something huge happens, such as Lehman or a lockdown. We’re paying closer attention to the three-month averages, which iron out some of those squiggles and include the revisions of prior data (red lines in the charts below).
So today, the jobs report by the Bureau of Labor Statistics came out hot for May in terms of jobs created (272,000) and in terms of wage increases (4.9% annualized).
They were hotter than “expected,” and stock futures tanked instantly when trading bots saw the headline because Wall Street wants a big-fat recession that would “force” the Fed to cut rates and end this horrible record QT and start QE all over again, but the economy is not cooperating with this dream.
A month ago, the jobs report for April had come out a little cooler, with a revised 165,000 jobs created and wage increases of 2.8% annualized. It was hailed as the beginning of the infamous and long-prayed-for slowdown in the labor market that would “force” the Fed to cut rates, or whatever, and helped promote the surge in stock prices.
But the three-month averages have been fairly steadfast for about a year showing what you’d expect from an economy that is moving along at a faster-than-normal clip, with higher-than-normal job creation, and with higher-than-normal wage increases documenting the inflationary environment that the economy is in.
Over the past three months, including revisions, employers created 249,000 new jobs per month on average – so that’s a net increase in payrolls. It has been in this range all year. There was somewhat of a slowdown in the second half of 2023 that has now vanished.
The three-month-average readings so far this year have been above or at the peak readings in the five years of the Good Times before the pandemic. For the US job market, these are big increases in employment.
We can also see in the blue line how volatile the month-to-month data is and that it cannot be used as an indication of a trend – though that’s all the headlines are about. It just gives you whiplash:
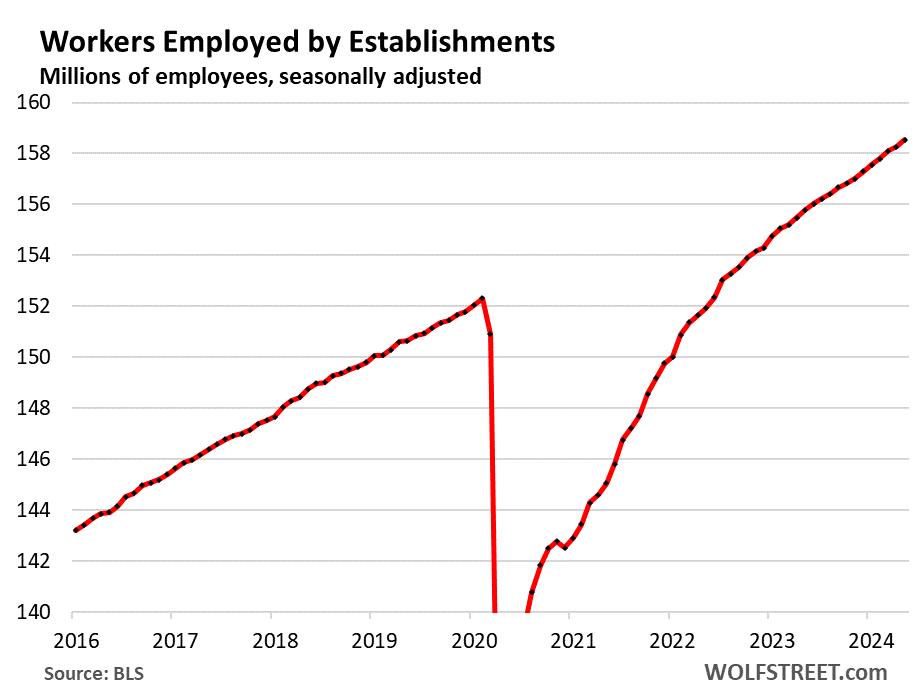
The total number of payroll jobs at employers rose to 158.5 million, a year-over-year increase of 2.76 million jobs (+1.8%). For the US economy over the past 20 years, these are substantial increases. No slowdown in sight either:
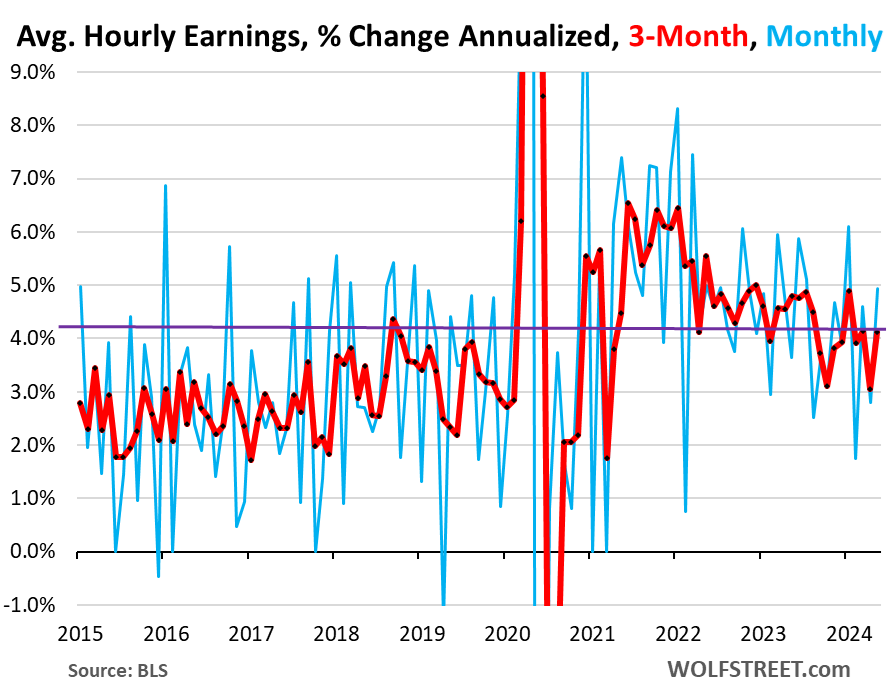
Average hourly earnings increased by 4.9% annualized in May from April, the biggest increase since January, and the second biggest increase since July 2023, according to the BLS survey of employers today. But it came after the small increase of 2.8% in April, and a 4.6% increase in March (blue in the chart below).
So the three-month average, which irons out some of those squiggles, rose by 4.1% annualized in May, well above the normal levels before the pandemic (there was only one month with higher readings in the five years before the pandemic, and the majority of readings were in the 2% to 3.5% range. So this speaks of higher inflation in the current economy.
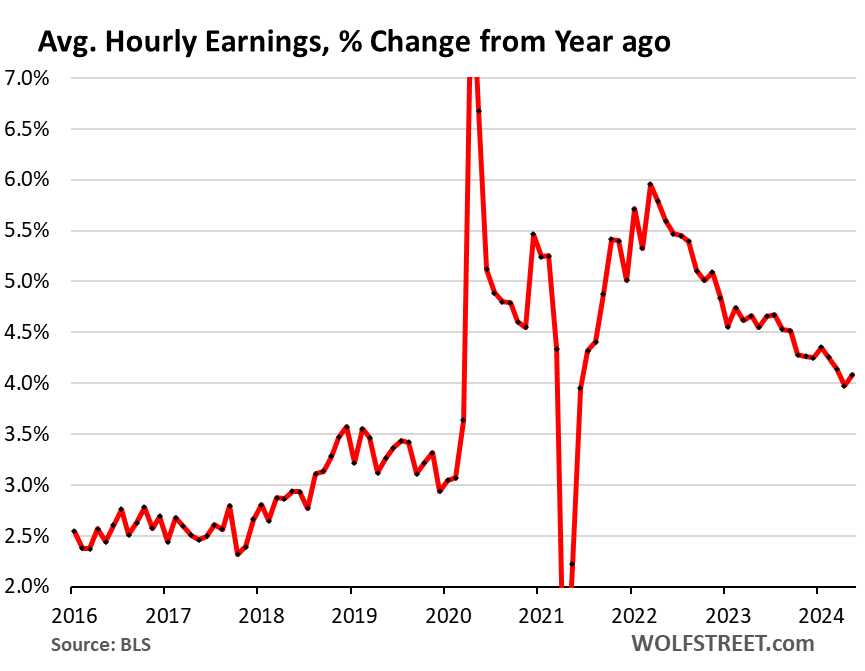
On an annual basis, average hourly earnings rose by 4.1%, a faster pace than in April (4.0%), and well above the five-year prepandemic range of 2.5% to 3.5%.
Household survey data messed up by huge undercount of immigrants.
The Bureau of Labor Statistics also releases a trove of data from its survey of households, including total employment (which include farm employment and self-employment), part-time employment, full-time employment, labor force, participation rates, unemployed, unemployment rates, etc.
All of this data is based on household surveys that are then extrapolated to the population estimates by the Census Bureau.
However, the Census Bureau has underestimated the mass-migration in 2022 and 2023, and has therefore underestimated the population growth, and overall population.
The Congressional Budget Office (CBO), in its population estimates, picked up on the huge wave of immigration by also including data from Immigration and Customs Enforcement (ICE). It estimated that net immigration in 2022 was 2.67 million immigrants, and in 2023 was 3.3 million immigrants, the highest in its data going back to 2000, and about triple the average rate between 2000 and 2021 (1.05 million immigrants per year).
In terms of population growth:
- CBO: 0.89% for 2022 and 1.14% for 2023, the highest since 2005.
- Census Bureau: 0.36% for 2022 and 0.49% for 2023.
We discussed this in detail here: How the Huge Wave of Immigrants into the US in 2022 and 2023 Impacts the Employment Data of the BLS Household Survey
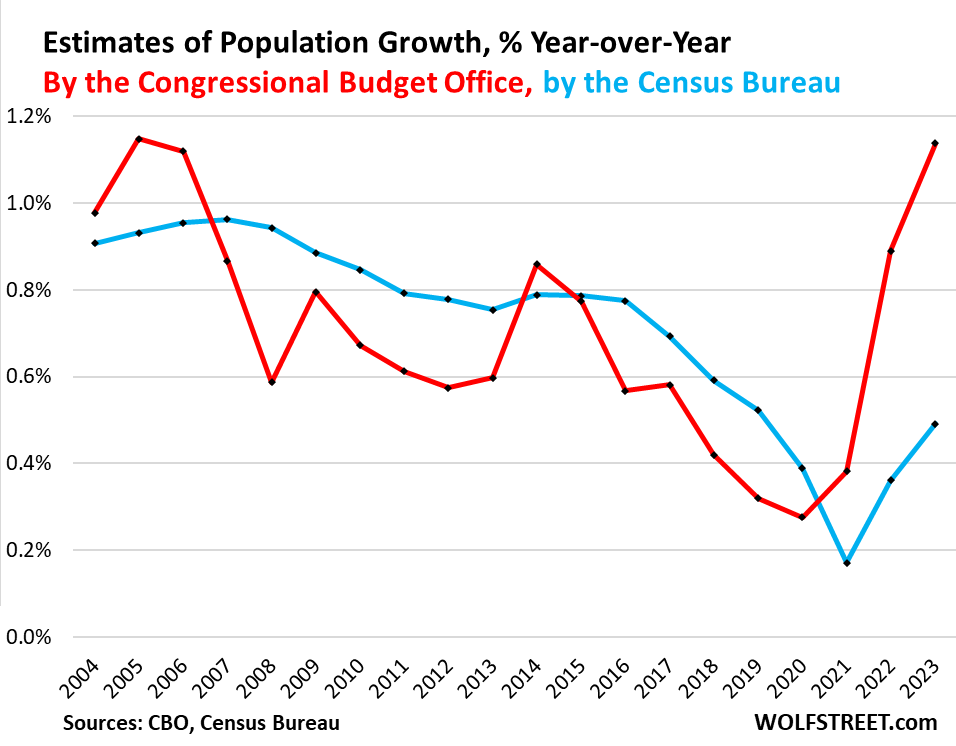
Because the BLS extrapolates its household survey data to the wrong population estimates by the Census Bureau, it understates employment and the labor force and messes up all other metrics based on them. So we will no longer cover the household survey data for that reason until the Census Bureau revises its population estimates, which it does periodically. Right now, it just doesn’t make sense.
The Census Bureau has also overestimated the prices of new single-family houses sold during the pandemic, and in its revision in May revised away 25% of the price spike of new houses during the pandemic. We’re now waiting for a massive upward revision of the population estimates before we report on the BLS’s household data again.
Enjoy reading WOLF STREET and want to support it? You can donate. I appreciate it immensely. Click on the beer and iced-tea mug to find out how:
Would you like to be notified via email when WOLF STREET publishes a new article? Sign up here.
![]()

