According to the criteria for IV selection, a total of 1,531 SNPs were identified and selected as IV associated with gut microbiota. The F-statistics for these IVs all exceed 10, suggesting that the estimated coefficients are improbable to be influenced by the bias caused by weak instruments. Supplementary Tables 1 and 2 provides detailed information about the selected IVs. None of the SNPs were involved in more than one of the association results in Fig. 3.
The majority of gut microbiota showed no significant correlation with AD. However, using the IVW method, we identified 9 bacterial features that were significantly associated with the risk of AD on genus level (Supplementary Table 3). We used 3 methods, IVW, weighted median and MR-Egger, and defined P
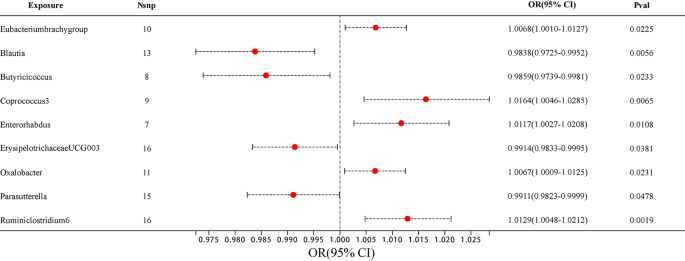
Among them, 4 bacterial genera are negatively correlated with AD, indicating that a higher genetically predicted a lower risk of for AD (Fig. 4 and Supplementary Table 4). They are: genus Blautia (OR = 0.9838, 95% CI, 0.9725–0.9952, P = 0.0056), genus Butyricicoccus (OR = 0.9859, 95% CI, 0.9739–0.9981, P = 0.0233), genus ErysipelotrichaceaeUCG003 (OR = 0.9914, 95% CI, 0.9833–0.9995, P = 0.0381) and genus Parasutterella (OR = 0.9911, 95% CI, 0.9823–0.9999, P = 0.0478). Supplementary Table 4 shows the completed data. In sensitivity analysis, MR-Egger, weighted median demonstrated consistent results, except for genus ErysipelotrichaceaeUCG003, where the MR-Egger trend was in the contrary direction compared to IVW and weighted median.
Another 5 bacterial genera showed a positive correlation with AD, genus Eubacteriumbrachygroup (OR = 1.0068, 95% CI, 1.0010–1.0127, P = 0.0225), genus Coprococcus3 (OR = 1.0164, 95% CI, 1.0046–1.0285, P = 0.0065), genus Enterorhabdus (OR = 1.0117, 95% CI, 1.0027–1.0208, P = 0.0108), genus Oxalobacter (OR = 1.0067, 95% CI, 1.0009–1.0125, P = 0.0231) and genus Ruminiclostridium6 (OR = 1.0129, 95% CI, 1.0048–1.0212, P = 0.0019) (Fig. 4 and Supplementary Table 4). In the MR-Egger method, the trends of genus Eubacteriumbrachygroup are different from those of the IVW and WM methods.
In horizontal pleiotropy analysis, we used the MR-Egger method and found P-value of the MR-intercept were all greater than 0.05. In addition, further MR PRESSO analysis was conducted, ruling out the existence of horizontal pleiotropy (P > 0.05) (Supplementary Tables 5 and 6). To assess the heterogeneity of gut microbiome IVs, we employed Cochran’s Q test statistics, which revealed no heterogeneity among the gut microbiome IVs (P > 0.05) (Supplementary Table 7).
Reverse MR analyses were conducted to examine the links between the 9 bacterial genera and AD. No significant statistical relationship was observed using the IVW method: genus Eubacteriumbrachygroup (OR = 1.4058, 95% CI, 0.4060–4.8674, P = 0.5909), genus Blautia (OR = 0.9453, 95% CI, 0.5572–1.6038, P = 0.8348), genus Butyricicoccus (OR = 0.9834, 95% CI, 0.5704–1.6952, P = 0.9518), genus Coprococcus3 (OR = 0.8886, 95% CI, 0.5040–1.5667, P = 0.6831), genus Enterorhabdus (OR = 1.0383, 95% CI, 0.4168–2.5868, P = 0.9356), genus ErysipelotrichaceaeUCG003 (OR = 0.6593, 95% CI, 0.3556–1.2221, P = 0.1858), genus Oxalobacter (OR = 1.2849, 95% CI, 0.4021–4.1051, P = 0.6724), genus Parasutterella (OR = 0.7245, 95% CI, 0.3713–1.4136, P = 0.3447), genus Ruminiclostridium6 (OR = 0.7095, 95% CI, 0.3825–1.3162, P = 0.2764) (Supplementary Tables 8 and 9).


