- FET fell by over 20% in the last 48 hours
- Metrics flashed mixed signals on the charts
FET has seen a sharp decline of over 20% in less than 48 hours. This sudden price drop left investors curious to understand the implications and FET’s next possible moves. Before this sudden drop, however, FET had been on an impressive rally on the charts.
It had surged by approximately 73% since retesting its all-time low. However, its latest price action has erased a significant portion of these gains. Needless to say, this sudden reversal raises questions about market sentiment and underlying fundamentals.
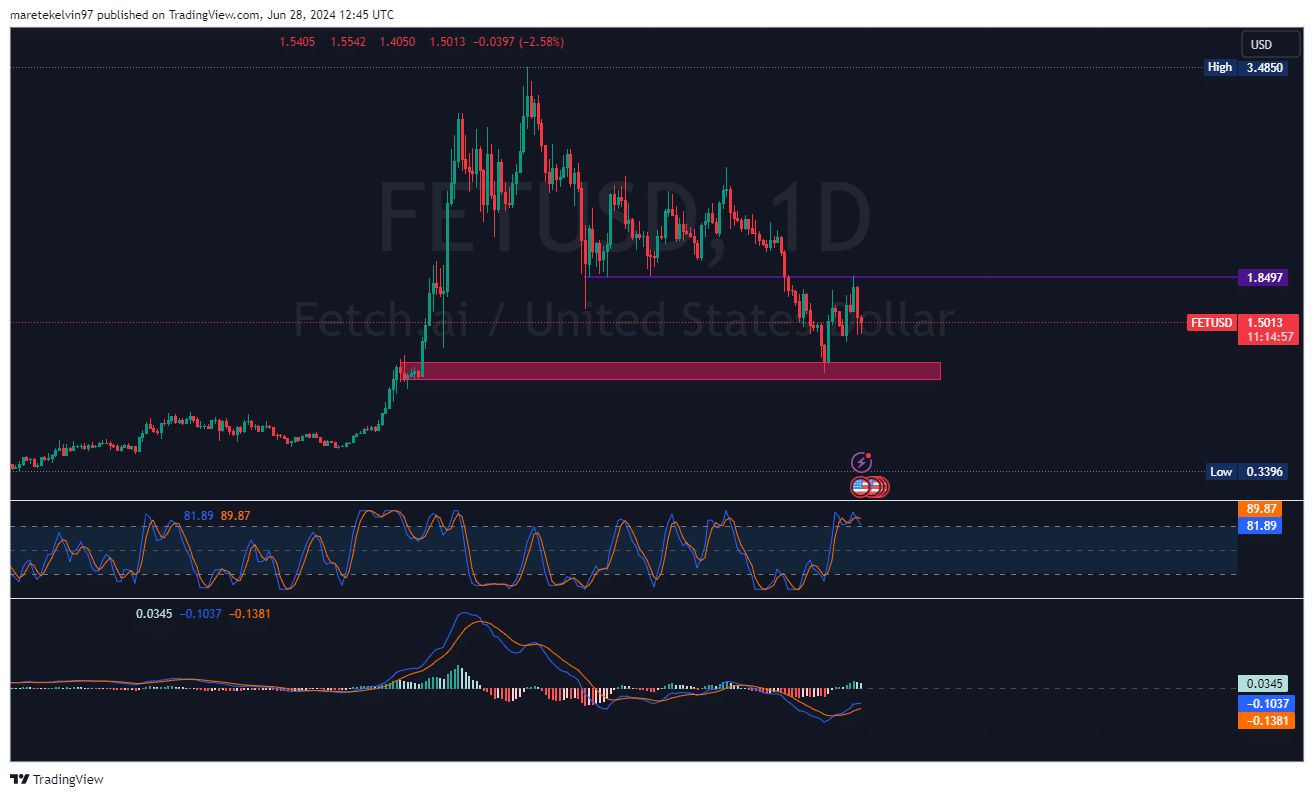
At the time of writing, FET was valued at $1.50, following a 7.30% drop in the last 24 hours. Its market capitalization declined by 18.27% over the same period too.
On the charts, both the Stochastic RSI (89.87) and the MACD indicated an overbought position, suggesting that a price pullback is likely.
Volume spikes amid sell-offs
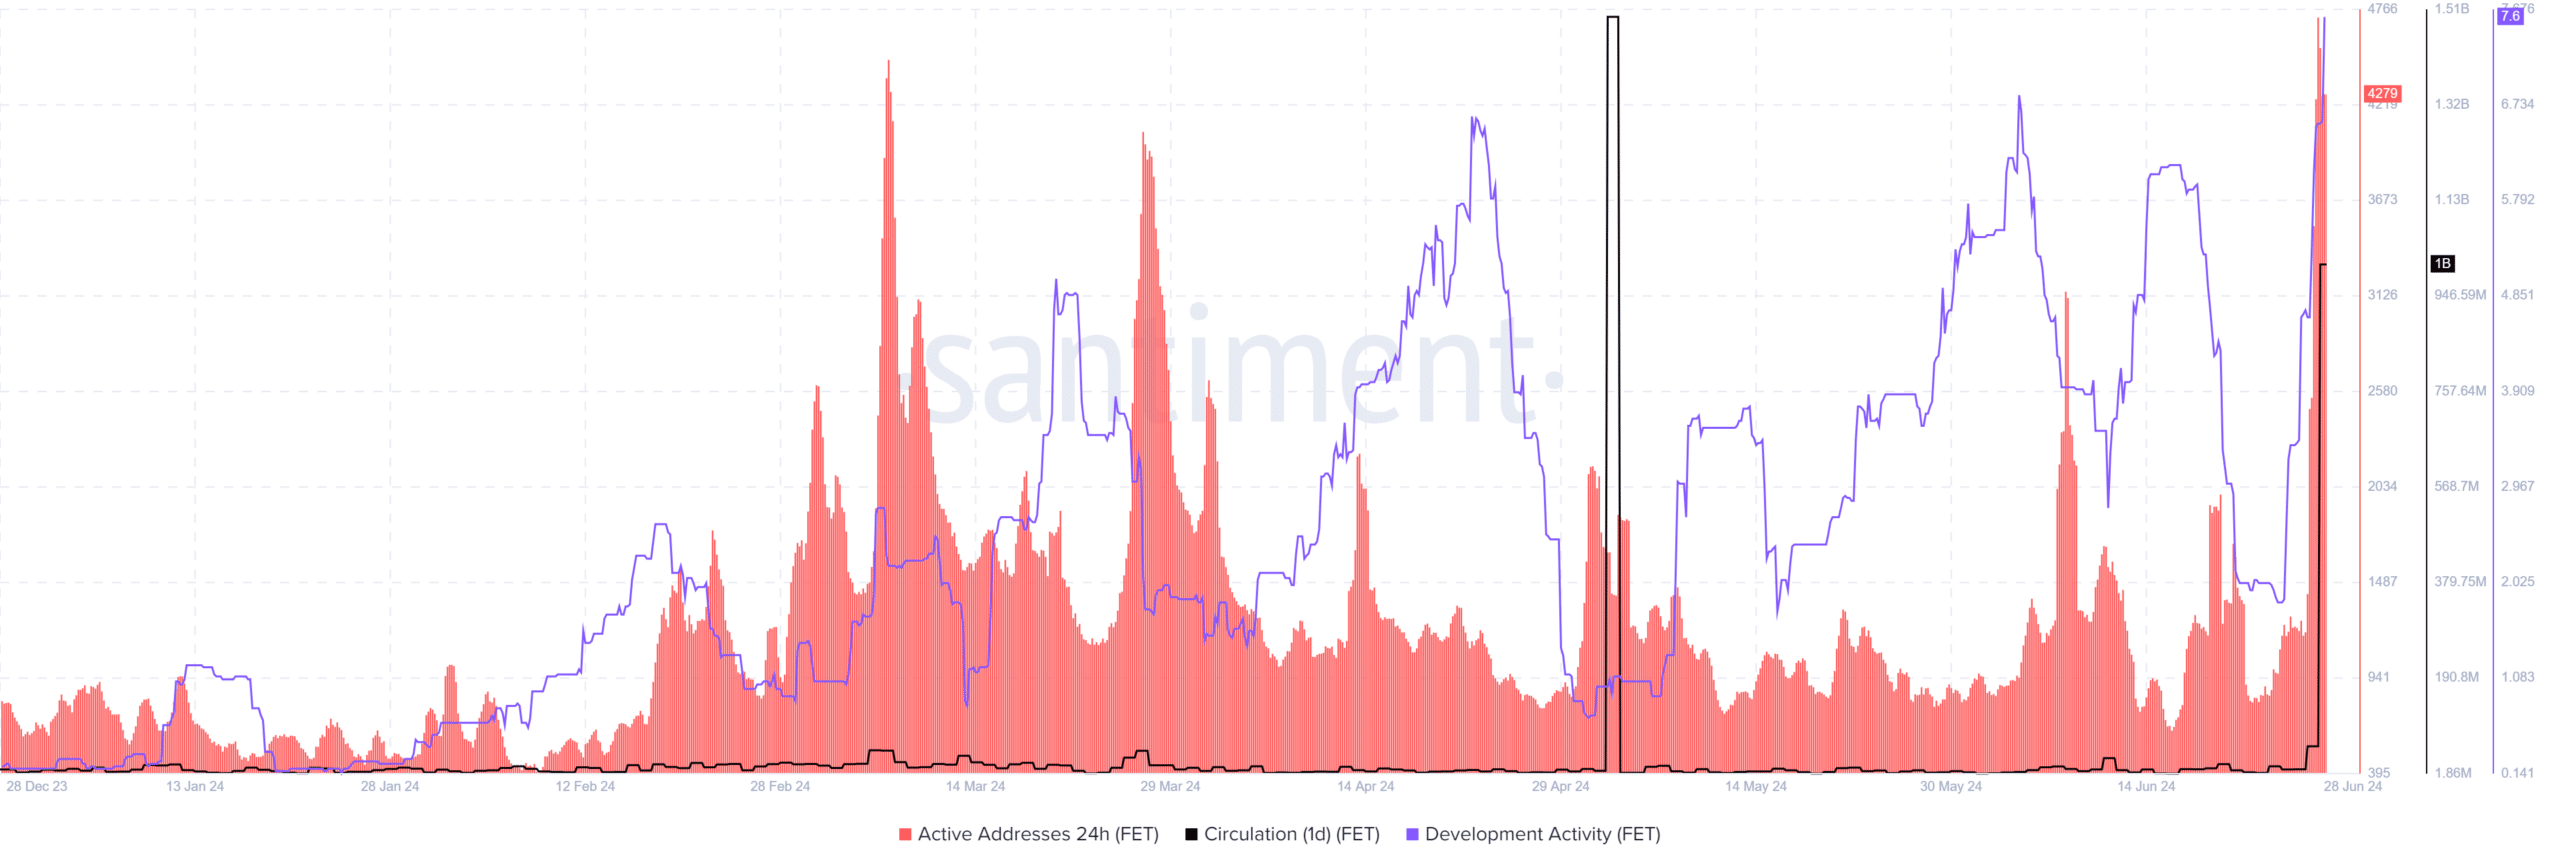
AMBCrypto analysed data from Santiment for further insights. The data revealed a notable spike in trading activity during the downturn. The 24-hour active address count for FET spiked dramatically, indicating increased network participation as prices tumbled.
Interestingly, development activity metrics for FET have remained relatively stable throughout these price fluctuations. This suggests ongoing work on the project’s core technology, potentially providing a silver lining for long-term holders.
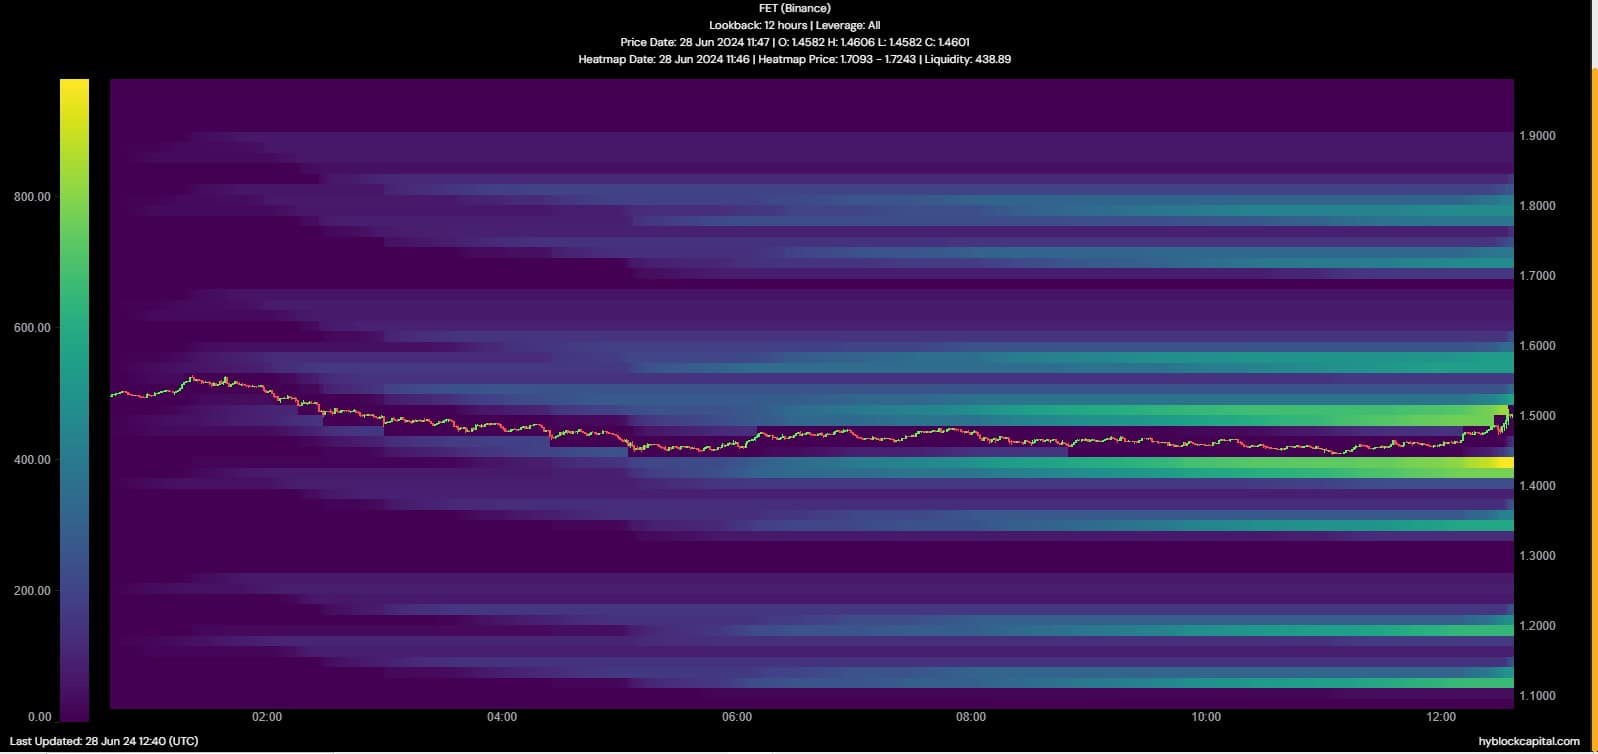
Additionally, the Liquidation Heatmap data from Hyblock pointed to a bearish bias over the last 12 hours. It also suggested that the short term bias is not over yet and that FET’s price may dip in the short run, before another long-term rally.
We further analysed the long/shot ratio data to evaluate the market’s direction. The data indicated fluctuations in the long and short positions. This is a critical finding, especially since in recent times, short positions have taken control of the market.
Uncertainty around token migration
The broader crypto market has faced greater volatility lately. FET’s price charts seemed to reflect this volatility too. However, it’s worth pointing out that the recent announcement regarding Coinbase’s position on the ASI token migration may have scared some investors.
What is ahead for FET?
FET holders should look out for key support and resistance levels in the coming days. The $1.40–$1.50 range appears to be a critical zone. If the selling pressure persists, FET could retest a potential recent low of around $1.20.
Otherwise, reclaiming the $1.80-level could signal a potential trend reversal and fuel bullish momentum.


