Which teams are the best starters? Who comes into the contest as it progresses? Who storms home?
We’ve dissected each of the 18 clubs and how they perform in each of the four quarters.
We do want to point out, however, that six teams have played 14 games while 12 sides have played only 13, so the numbers are a tiny bit skewed (but it isn’t overly evident).
See the numbers and our synopsis below:
1st quarter
-
Brisbane and GWS are the only teams to have won 10 opening quarters (from 13 attempts). The Lions average 28.5 points per first term, the best in the league.
-
Port Adelaide and Geelong have also started well in 2024, winning nine first terms.
-
The Western Bulldogs have scored the second most points (360) but from 14 games and despite winning only 50 per cent of their opening quarters.
-
North Melbourne has struggled in winning just two of 13 first terms, while St Kilda has the lowest opening-term percentage of 65.75.
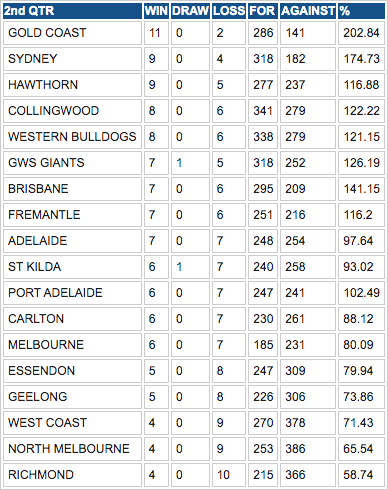
2nd quarter
-
Having won just four first terms, Gold Coast tends to get things rolling in the second quarter by winning 11 of 13 second quarters. The Suns are strong defensively in that period, conceding just 10 points, and outscoring their opponents by 145 points.
-
Collingwood is the second highest scoring team with 338 points at an average of 24.3 points. 13-game sides Sydney and GWS both shade the Pies with an average of 24.4 second-term points.
-
Richmond has lost the most second quarters (10), while winning the equal least (4) with the lowest percentage of 58.74.
-
Melbourne averages just 14 points per second term as the only side not to reach 200 points yet have still won six while losing seven.
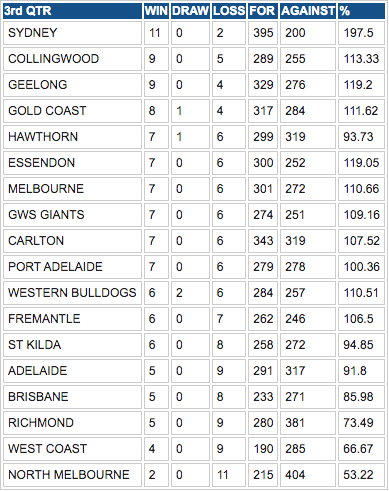
3rd quarter
-
The Swans are dominant in the third terms, winning 11 of 13 by outscoring their opposition by 195 points. They average 30 points in third quarters. They’re comfortably the best third-quarter team across all key metrics.
-
The Magpies and Cats are also very strong in the ‘premiership quarter’ in winning nine and the Suns have won eight and drawn one of their 13.
-
The Blues score heavily in third terms with 343 at an average of 26, but it hasn’t necessarily led to dominance as they’ve won seven of 13.
-
The Kangaroos have only won two with a percentage of just over 50. West Coast has struggled in this period also, scoring a league-low 190 points at an average of 14.3.
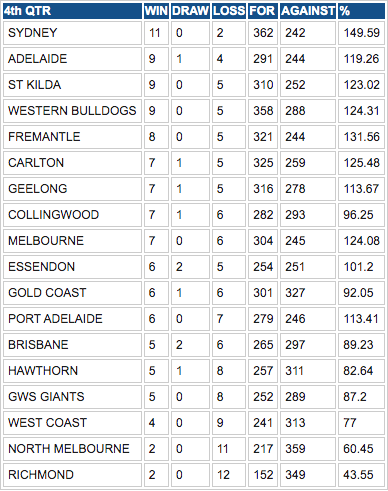
4th quarter
-
Sydney’s form rolls into the last quarter where they are also 11-2 with a strong for score of 362 (average of 27.8). In the second half in 2024, the Swans have scored 757 at an average of 58 while conceding 442 at an average of 34, outscoring their opponents on average by four goals.
-
Adelaide shines in final terms, winning nine and drawing one of 14. It is the only quarter the Crows have a positive win-loss rating in.
-
St Kilda, the Bulldogs and Fremantle also perform well in final quarters, scoring over 300 points total each.
-
The Tigers and Roos sit at the foot with just two final-term wins apiece. The Tigers really drop away late, scoring just 10.8 points and conceding 24.9.
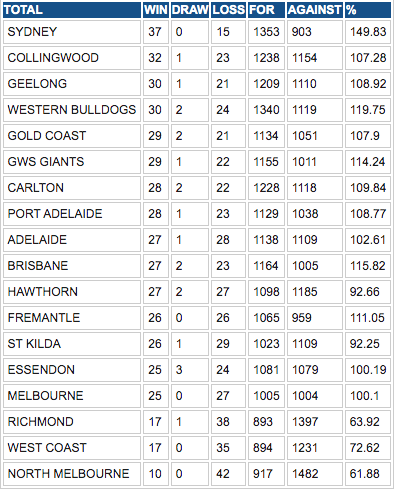
Overall
Most won
-
Sydney has won 37 of 52 quarters, resulting in the club’s 12-1 win-loss record.
-
Collingwood sits second for quarters won with 32 (and one drawn) from their 56 quarters played.
-
Geelong and the Western Bulldogs have won 30 each but the Cats have played one less game. The Bulldogs currently sit out of the eight despite having the fourth best quarter-by-quarter record.
-
Gold Coast has won the fifth most quarters but are also out of the eight.
Least won
-
North Melbourne has won only 10 quarters in 2024 and has lost the most (42).
-
West Coast and Richmond both have 17 quarter wins, the Tigers edging the Eagles with one drawn. The Tigers have played one more game.
-
Essendon and Melbourne are next with 25 quarters won apiece. The Bombers have also drawn three. They sit fourth on the ladder but have the fifth worst quarter-by-quarter outcome.