
Harry Ottley, Economist at CBA, has written the below excellent report explaining how government-aligned jobs such as those related to the National Disability Insurance Scheme (NDIS) has driven almost all of Australia’s job growth.
As a result, the labour market appears to be somewhat disconnected from broader economic outcomes.
Key Points:
The labour market is gradually loosening but to date, it has been tighter than we expected.
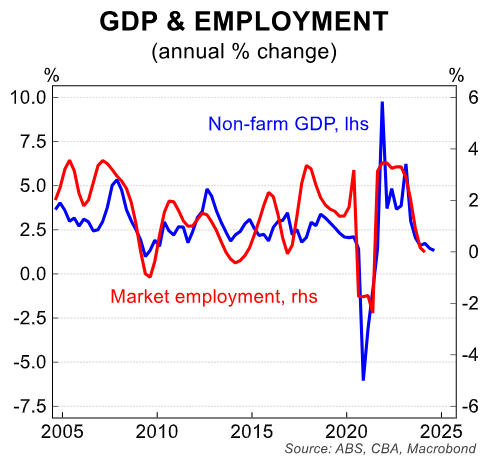
Economic growth has slowed materially, but employment growth has so far remained robust.
A deeper dive into the ABS labour account data reveals that much of the recent strength in employment growth has come from non-market industries.
Advertisement
Restrictive monetary policy has slowed GDP growth and the relationship between production and the market labour sector has held. But the non-market labour force, less tied to the business cycle, is cushioning the overall easing of labour market conditions.
Strength in non-market employment is being driven by social services within the health employment group.
The strength of employment growth in the non-market sector may be weighing on measured productivity growth.
Advertisement
We expect the labour market to continue to loosen in line with ongoing below-trend GDP growth.
The state of play:
The labour market is loosening but overall remains in decent health.
Advertisement
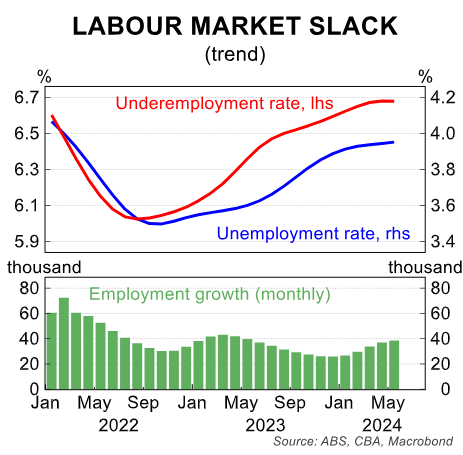
In the most recent labour force survey, the unemployment rate fell from 4.1% to 4.0% in May, with employment increasing by ~40k.
In trend terms, the unemployment rate rose to 4.0%, tracking right on the RBA’s forecast for Q2 24.
Advertisement
Assessing the labour market in trend terms can be useful for looking through the volatility of the monthly seasonally adjusted figures.
The following chart shows that a gradual loosening in conditions remains underway. Trend employment has grown by less than required jobs to keep the unemployment rate over the past eighteen months.
Advertisement
The slow pace of the rise in the unemployment rate so far and continued robust trend employment growth has surprised us and to a lesser extent the RBA.
For context, a year ago, the RBA expected the Q2 24 unemployment rate to be 4.2% (vs 4.0% actual) and employment growth to be 1.1% (vs. 2.7% actual).
Much stronger population growth than forecast accounts for some of the disparity on the employment growth front, but even so, labour market outcomes have certainly surprised to the upside given the weak GDP picture.
Advertisement
There are several plausible explanations that can go some way to squaring the circle of well below-trend growth, but stronger than expected labour market performance.
So far it looks like firms are opting to reduce hours for employees rather than engage in job shedding.
Advertisement
Indeed, hours worked is growing by a lot less than growth in employment. And a bigger rise in the underemployment rate vs the unemployment rate indicates there are plenty of people out there who have a job but are seeking more hours.
It is generally an easier decision for businesses to reduce hours for workers than to reduce headcount.
This is particularly so for firms that have a material share of casual employees. By keeping an employee on the books, employers do not have to go to a competitive labour market if business conditions improve (as is generally expected to be the case in 2025).
Advertisement
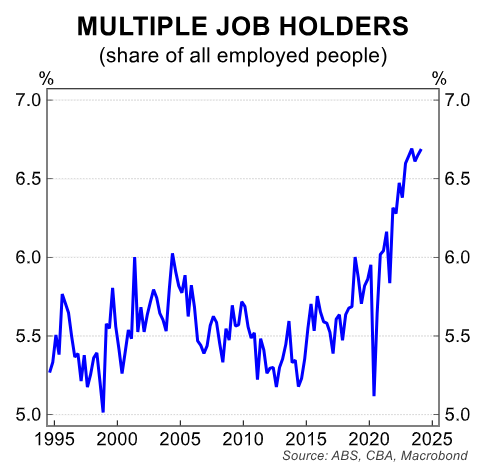
Increased labour market flexibility could also be playing a role. More employees than ever before have more than one job and the rise of the gig economy and remote work means workers can move between roles more easily and are more adaptable.
It is also possible that Australia’s output gap is positive and that overall demand in the economy still exceeds supply, creating demand for labour and supporting the labour market.
Advertisement
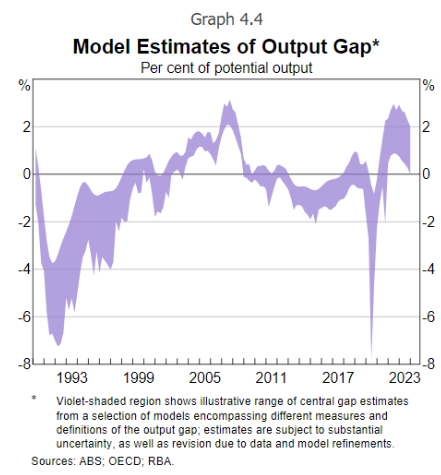
That said, we are of the view that the output gap has closed. The recent moderation in wages growth supports this view.
Notwithstanding, the RBA remains concerned that demand might still be outstripping supply and that this is contributing to elevated inflation.
Advertisement
The above factors are plausible contributors to the current resilience of the labour market.
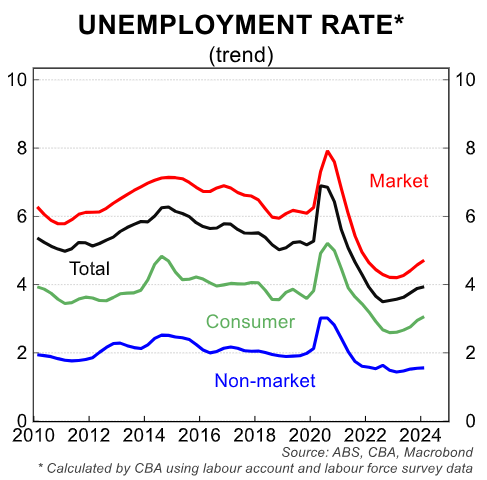
However, our analysis indicates that strength in non-market sector employment is the primary reason the labour market has so far held up better than anticipated.
The non-market labour market:
Advertisement
The non-market sector labour market is defined by the ABS as comprising health care and social assistance, education and training and public administration and safety. These industries are tied to government services and are less responsive to cyclical changes in the economy.
The three scatter charts at the end of the note illustrate that there is a positive correlation between GDP and market employment, and an even stronger positive relationship between household consumption and the consumer exposed labour market.
There is, however, no relationship between the business cycle and non-market sector employment. This point is critical when squaring the circle between weaker than expected economic activity and a stronger than expected labour market.
Advertisement
The employment data presented in this note primarily uses the labour account. The quarterly labour account is the best and most comprehensive data source to analyse industry labour market performance.
According to the ABS, “The Labour Account measures jobs, employed people, hours, and income in Australia. It uses the best available labour market data to create our most comprehensive source of information”.
When comparing the labour account to the labour force survey: “Labour Force Survey (LFS) industry data is released earlier than Labour Account industry data (as the Labour Account relies on a range of data sources). While the LFS data may provide some useful early insights, the Labour Account data is our definitive read on industry employment and jobs levels and changes over time. The LFS industry data provides important context for other LFS data, however collecting industry information from a household survey has limitations and these estimates may not provide the best indication of real-world levels or changes.”
Advertisement
The main downside of the release is that it is lagged, with the most recent data to Q1 24. Notwithstanding, it is the best dataset to understand industry labour market analysis.
Our key finding is that much of the strength in employment growth over the last year or so has been driven by the non-market sector.
According to the labour account and in trend terms, employment growth to March 2024 was ~322k, or 2.3%. Of this, an increase of ~316k came from the non-market sector, and ~6k from the market sector.
Advertisement
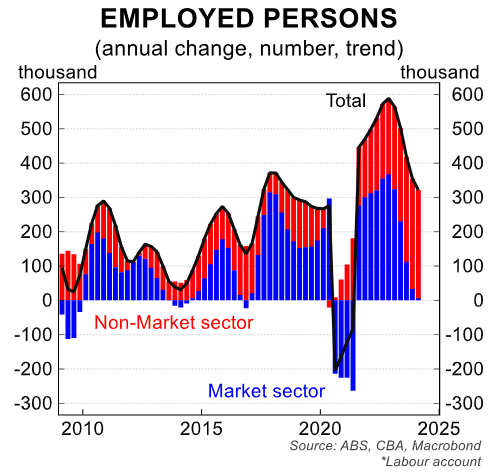
This represents annual growth of 2.3% for the total labour market, 7.6% for the non-market sector and just 0.1% for the market sector. The 7.6% annual growth rate for the non-market sector is just off the record high of 7.9% in the previous quarter and well above the long-term average of 2.9%.
Advertisement
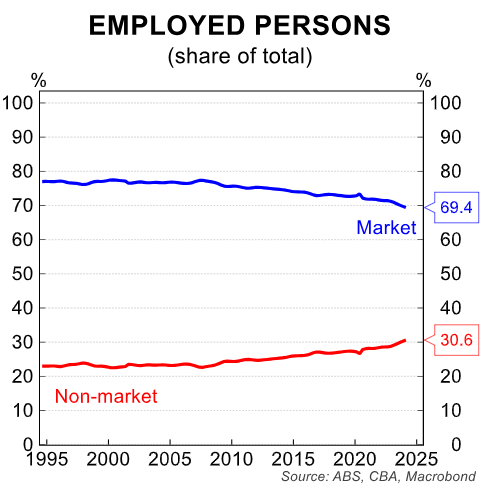
For context, the market sector is 69% of total employed persons. In contrast, 31% of workers are employment in the non-market sector.
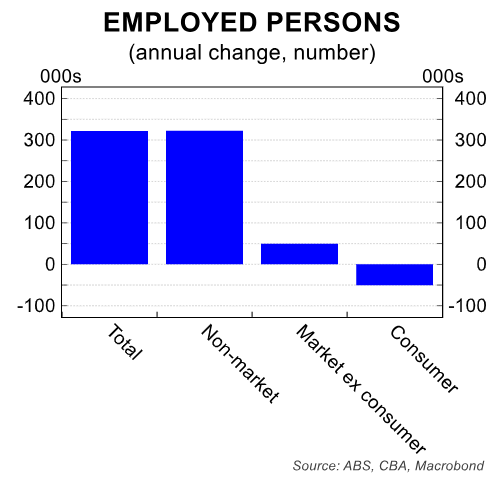
A key implication here is that the segments of the labour market that are tied to the business cycle have softened materially. This is especially true of industries exposed to the current weakness in household consumption.
Advertisement
We have identified five industries in this category: wholesale trade, retail trade, hospitality, arts & recreation and other services.
Employment in these sectors has fallen by ~50k or 1.3% in the year to February 2024. The slowdown in economic growth has generated a gradual loosening in the labour market.
However, this has occurred concurrently to the biggest surge in non-market employment in the history of the dataset.
Advertisement
In our view, this goes some way to explaining the surprising resilience of the Australian labour market. And it helps to explain the apparent weakness in productivity growth as measured by GDP per hour worked.
Health and social assistance employment driving strength in the non-market sector:
Over the year to Q1 24, the labour account data shows by far the strongest growth in terms of the number of employed persons within the non-market sector is in health & social services.
Advertisement
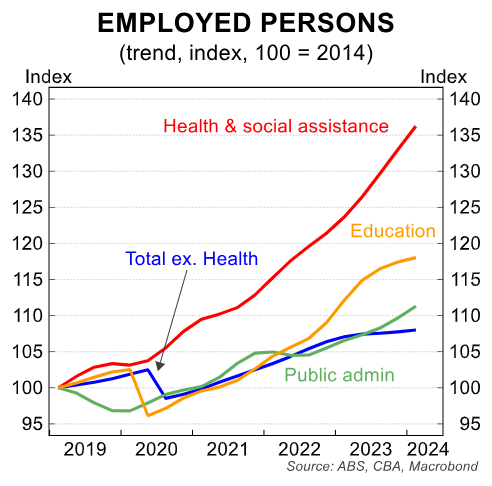
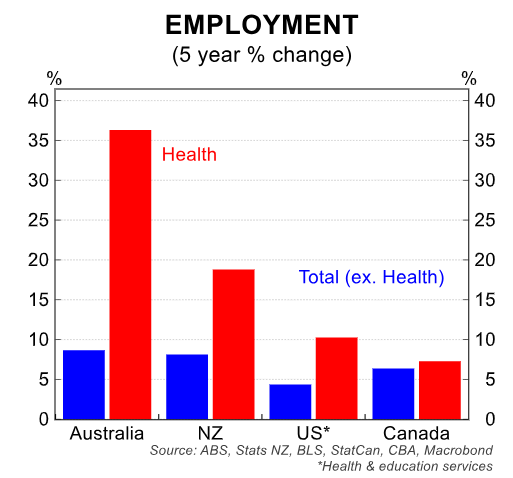
Employment growth over the year in the sector is 10.2%, compared to 0.9% for total employment excluding health. This trend holds over a longer time series with health employment up 36.2% over the last five years, compared to 8.0% for total employment excluding health.
The strength of employment growth in the health sector is much stronger over the past five years compared to peer economies such as NZ (~19%), the US (~10%) and Canada (~7%).
Advertisement
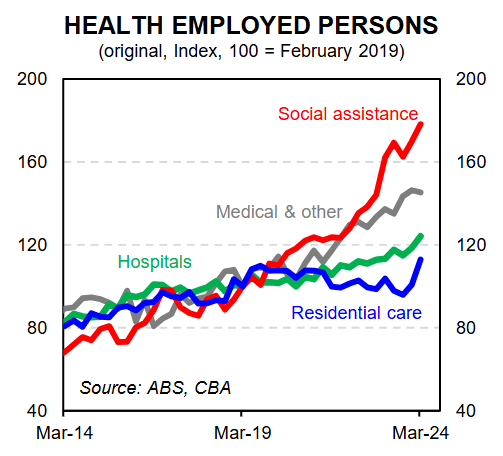
Delving into the subsectors of the industry, it is the social assistance sector that has seen most of the growth over the last year and over the last 5 years. Since Q1 2019, the number people employed in the social assistance sector has risen by ~78% (+292k) compared to ~12% (+1.5m) for employment in total.
Advertisement
The increasing NDIS aligned workforce likely goes most of the way to explaining the exceptional growth in this specific sub-industry.
The role of the public sector in the current cycle:
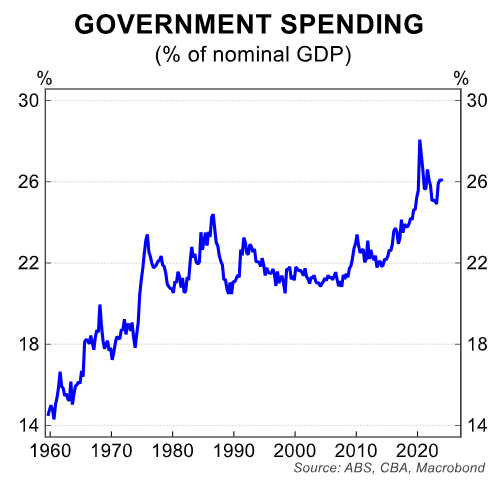
Government spending is rising as a share of the economy. As my colleague Belinda Allen noted, the government share of GDP is sitting at close to record highs. Indeed, it is at a record high outside of the pandemic period.
Advertisement
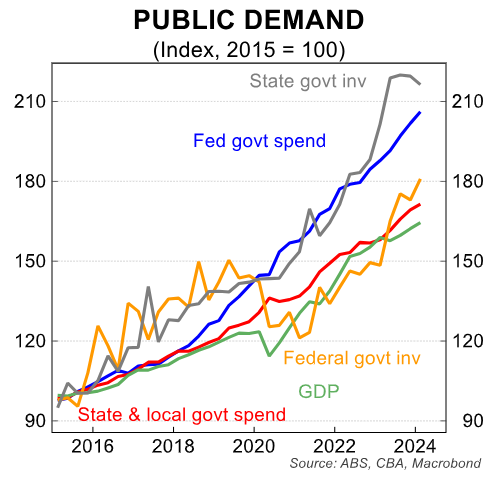
Federal government recurrent spending and state government capex spending have risen the most over the past decade. In the year to Q1 24, public demand was the dominant driver of GDP growth, contributing 1.2ppts of the 1.1% overall growth.
Advertisement
Government spending has cushioned GDP growth as the private side of the economy has slowed under the weight of restrictive monetary policy, higher taxes paid as a share of income and elevated inflation.
The growth in the non-market labour market outlined in this note also suggests that government is cushioning the labour market.
Advertisement
The sectors exposed to a slowing economy have softened but the non-market sectors have remained resilient. This may also be impacting on productivity outcomes.
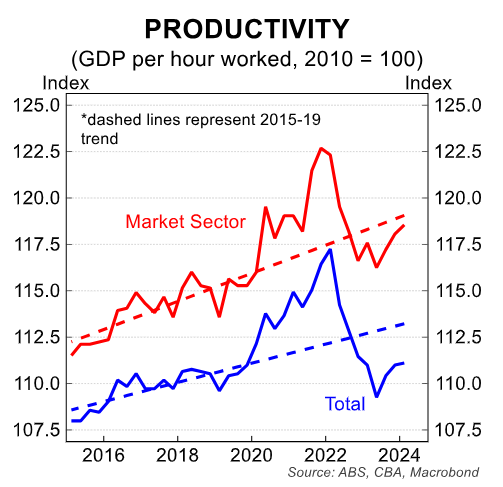
As Gareth Aird noted, market sector productivity has risen in recent quarters and is only marginally below the pre-covid trend line. Total productivity, though, remains well below the trend line, suggesting non-market sectors are seeing comparatively poorer productivity outcomes.
Advertisement
With much of the recent jobs growth primarily driven by non-market sectors, this is likely an impediment to overall measured productivity growth in the economy.
Conclusion:
The labour account is more lagged than the detailed labour force survey, but according to the ABS, it is still the best data source to analyse changes in industry and sub-industry labour forces over time.
Advertisement
The most recent labour account data shows that over the year to Q1 24, almost all the growth in employment has been driven the non-market sector, primarily concentrated in social services within the health industry.
We do not expect the growth in social services employment to continue at its current pace.
The non-market labour sector is not empirically linked to the business cycle in the way the market labour sector is. As such, exceptionally strong growth of employment in the non-market sector has softened the blow of a sharply weaker market employment growth, especially industries exposed to the consumer.
Advertisement
Government spending continues to grow as a share of the economy. Public investment has been especially strong in recent years, but government recurrent spending (consumption) is also rising much faster than nominal GDP growth.
In this part of the cycle, with the economy slowing, the government has supported overall economic activity with spending, but there is increasing evidence it is indirectly also keeping the labour market tighter than would have ordinarily been expected.
Growth in the social services sub industry of the health sector has been incredibly strong. This is likely tied to rapid increase of spending on the NDIS.
Advertisement
In our view, the surprising resilience of the labour market appears to be somewhat disconnected to broader economic outcomes.
This may be a factor in wages growth peaking despite the unemployment rate sitting below most conventional estimates of the NAIRU.
The overall strength of the labour market remains a significant positive for the Australian economy.
Advertisement
However, if the growth in the non-market sector of the labour market slows in the context of weakness in the market sector, the unemployment rate could lift more sharply from here.
We continue to forecast an end year unemployment rate of 4.5%.